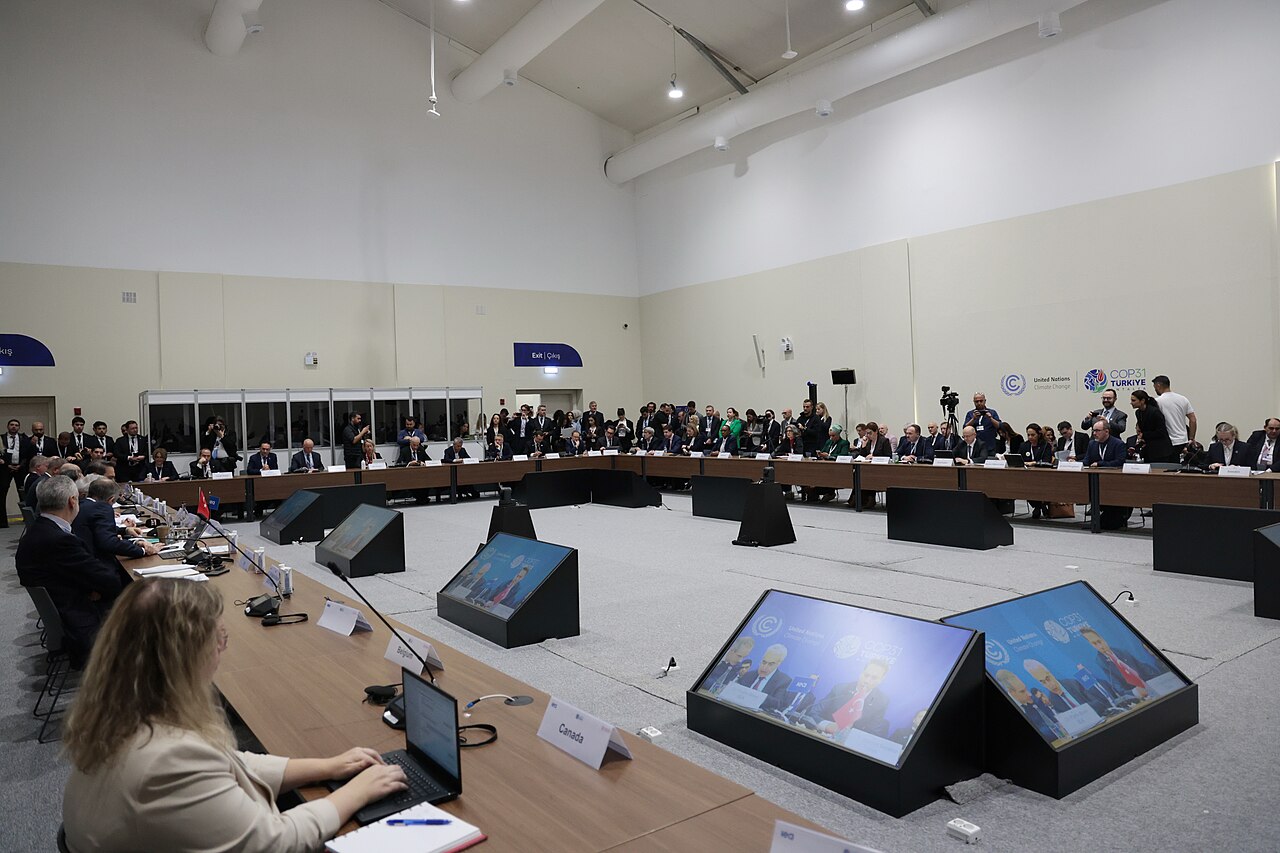
COP31 was still negotiating its central political text on Nov. 18. That is the clearest answer to the immediate question many readers had as climate reports piled up around the summit in Antalya: was there already a COP31 cover decision, or were delegates still debating one? Based on the UNFCCC documents here, delegates were still debating it. The presidency’s Nov. 16 draft was an unedited negotiating text prepared for consultations, and the presidency’s Nov. 18 work update said consensus was still missing on several major issues.
That unresolved status matters because a cluster of high-profile climate updates appeared at roughly the same time and could easily be read as if they formed part of one package. They did not. UNFCCC draft language set out proposals for possible agreement. The World Meteorological Organization and Copernicus reported observed temperatures and other indicators across specific time windows. The Global Carbon Project published a preprint under review with preliminary 2026 carbon estimates. Climate Action Tracker released conditional 2100 warming scenarios based on different policy assumptions. Together they described the climate context around COP31. They did not amount to an adopted COP decision.
What Nov. 18 meant procedurally
The UNFCCC presidency draft dated Nov. 16 was not the summit’s outcome. According to the document itself, it was prepared for presidency consultations. It ran to 18 pages and 144 numbered paragraphs. The parties had yet to adopt the draft itself.
The presidency’s Nov. 18 mid-week work update reinforced that point. It said negotiators still had work to do before reaching consensus on outstanding items. It credited progress on issues including the Climate Technology Centre, national adaptation plans, matters for least developed countries, climate funds and Article 6. But it also said differences remained on just transition, adaptation, finance, mitigation and response measures.
The same update set out a schedule rather than an agreement. Ministerial pairs and co-facilitators were to keep narrowing differences, with further drafts in those negotiations expected by early Thursday, Nov. 19. A new version of the separate cover decision would be offered as soon as possible. The update did not give a guaranteed release time for that text, and it said each element of the decision would require consensus.
The closing-plenary schedule also did not prove a deal existed. The first part of the closing plenaries was planned for Nov. 19 for drafts ready for adoption, with later-ready drafts to go to a subsequent closing plenary. That was a path for possible adoption. It was not evidence that the cover decision had already been agreed.
What was actually in the draft
Because the draft used concrete figures and formulations, it was easy to mistake some of its proposals for settled language. They were still options.
One example was the count of nationally determined contributions. The Nov. 16 text said 163 parties had submitted updated nationally determined contributions by Nov. 9. That was a count of national climate plans on file by that date. It was not a count of votes for the cover decision.
The draft also assembled competing approaches on some of the most sensitive substantive questions. Paragraphs 18 through 22 grouped proposals on possible overshoot of the long-term 1.5°C goal. Those proposals included reducing both the scale and the duration of any overshoot and addressing adaptation needs linked to that possibility. Their presence in the draft did not mean parties had agreed on overshoot, or on one response to it.
Energy language showed the same split between proposal and outcome. Paragraph 50 proposed that electricity account for 35% of total final energy use worldwide by 2035. That was a proposal about the share of final energy delivered as electricity. It was not a proposal that renewables should account for 35% of global final energy use, and it was not a statement about renewables’ share of electricity generation.
The fossil-fuel language was also not settled. Paragraph 65 referred to speeding implementation of the first global stocktake, including a just, orderly and equitable move away from fossil fuels in energy systems. Paragraph 66 contained a distinct, stronger proposal for an immediate transition away from fossil fuels in energy systems. The existence of both formulations in the same draft showed that the wording remained contested.
Another draft provision that needed careful reading was paragraph 58 on carbon dioxide removal. It described removal as a complement to deep emissions cuts and paired that with environmental safeguards and respect for Indigenous Peoples and local communities. In the text available here, removal was not framed as a substitute for cutting emissions.
Finance language was similarly tentative. Paragraph 36 cited a UNEP estimate of about $305 billion a year in adaptation finance needs for developing countries by 2035. The comparison point was international public adaptation finance of $28–32 billion for 2024. That comparison was not all climate spending, and it was not itself a new pledge. Elsewhere, paragraphs 72 through 74 assembled proposals on tripling adaptation finance by 2035, possible levels and a basis for measuring progress. Those were negotiating options, not money already committed.
How the temperature reports fit into the picture
The temperature reports released around COP31 were important background, but each measured a different slice of time.
The World Meteorological Organization released its climate update on Nov. 9 at the start of COP31 in Antalya. WMO said the report combined consolidated 2025 data with 2026 data up to September where available, and that different indicators had different observation cutoffs. Within that framework, WMO estimated global surface temperature for January through September 2026 at about 1.47°C above 1850–1900. That was a nine-month figure, not a full-year result.
WMO also said 2026 was expected to finish among the four warmest years on record and that 2015 through 2026 were expected to make up the warmest 12 years, subject to full-year data. Those statements described where 2026 was likely to land in the ranking once the year was complete.
According to the Copernicus Climate Change Service, drawing on ERA5 data, October 2026’s global average surface air temperature was 1.75°C higher than the estimated October average for the preindustrial period (1850–1900). When compared to more recent norms, the temperature for October reached a record-setting 15.35°C, making it the warmest October on record in ERA5, and this value stands 0.90°C above the October average for 1991–2020. The bulletin detailing these findings was made public on November 5, 2026.
Copernicus also said October was the third consecutive month above 1.5°C on that estimated pre-industrial comparison. But a monthly reading above 1.5°C is not the same thing as a finding that the long-term Paris temperature threshold has been crossed. The same caution applies to rolling periods. Copernicus said November 2025 through October 2026 averaged 1.51°C above the estimated pre-industrial baseline in ERA5, but that was a moving 12-month window, not the 2026 calendar year.
The year-to-date comparison differed again. Copernicus said the January through October average in ERA5 was the second highest for equivalent ten-month periods in the record, at 0.64°C above 1991–2020. That was 0.07°C below the equivalent period in 2024. Copernicus also used a statistical model to estimate the likely full-year 2026 anomaly at 1.56–1.61°C above the estimated 1850–1900 comparison, with a 95% prediction interval because November and December had not yet been observed. The same model estimated about an 80% probability that 2026 would finish second to 2024 and a greater than 99% probability that the calendar year would exceed 1.5°C.
The main distinction is simple but important. A nine-month estimate, a single monthly anomaly, a rolling 12-month average and a modelled full-year projection can all be correct at the same time because they refer to different periods and, in some cases, different methodologies. None of those figures by itself was a COP31 negotiating outcome.
What the ocean indicators were showing
The ocean evidence published around the summit also came with separate time windows and measurement limits.
WMO reported that global mean sea level in June, July and August 2026 was the highest in the satellite altimetry record, which begins in 1993. It also reported average sea-level rise of 2.4 millimetres a year for 1993–2002 and 3.9 millimetres a year for 2017–2026. WMO identified warming water and melting land ice as contributors to the long-term rise, while saying rainfall changes connected to El Niño may have helped raise the most recent value. That is the distinction between long-term contributors and a possible influence on the latest reading.
Ocean heat content was a different measure again. WMO said the amount of heat held in the upper 2,000 metres of the ocean in 2025 was the highest in the record and about 19 ± 11 zettajoules above the 2024 estimate. Measurements through July 2026 pointed to a continued increase. Those 2026 ocean heat indications were preliminary through July. They measured stored heat in a deep layer of the ocean, not sea-surface temperature.
WMO gave two warming-rate estimates for the upper ocean, and the time coverage was not the same. For 1971 through July 2026, the rate was about 7 ± 1 zettajoules per year. For 2005 through July 2026, it was about 11 ± 1 zettajoules per year. Those are estimates for different periods with different coverage. They should not be collapsed into a single like-for-like comparison.
WMO also noted that the later period has wider observation coverage because of the Argo profiling floats. That wider coverage is part of the observing context for the more recent window.
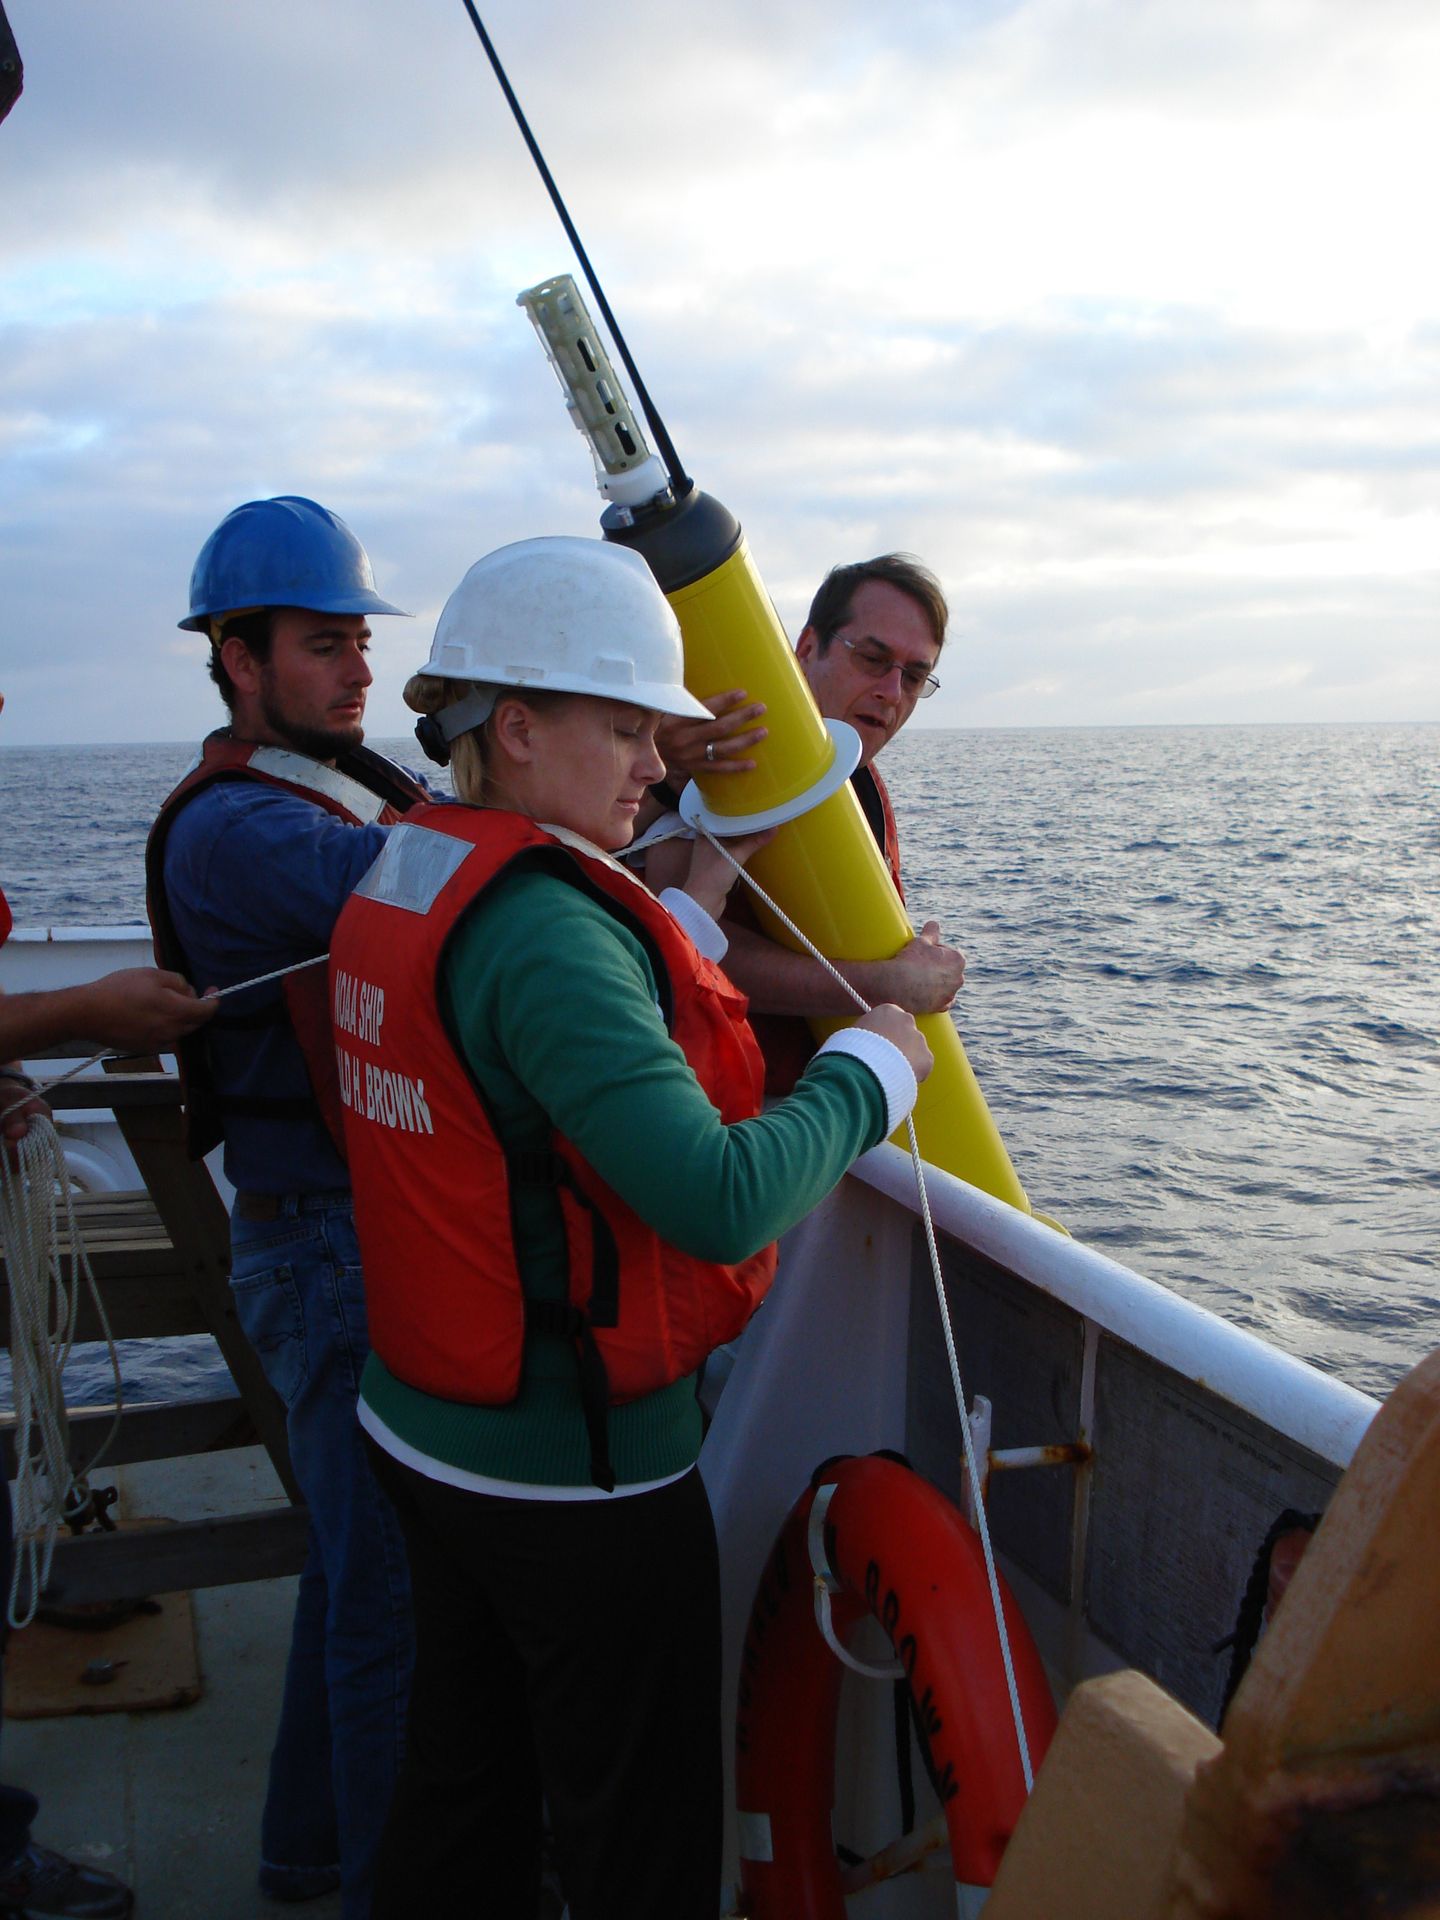
Copernicus supplied a surface-ocean view for October. It reported that sea-surface temperature between 60°S and 60°N averaged 20.95°C, the highest October value in ERA5, and said this was the fifth consecutive monthly record for the corresponding month. In the Niño 3.4 region of the equatorial Pacific, Copernicus reported an October average of 29.94°C, with an anomaly of 3.21°C above the 1991–2020 average, exceeding the record set in September. That figure was regional rather than global.
WMO said El Niño had become stronger since August and projected a peak by December, with elevated risks of heat, drought and heavy rain extending into 2027. Those were risk outlooks, not attribution of every event. Copernicus associated the October sea-surface conditions with growing El Niño in the Pacific and elevated temperatures in other ocean regions. WMO also said the long-term fall in surface ocean pH continued in 2026 as seawater absorbed CO₂.
What the carbon budget estimated for 2026
The Global Carbon Project’s Global Carbon Budget 2026 answered a different question from the temperature reports. It estimated emissions and carbon flows, not short-term heat anomalies. It also came with a status label that matters: the document was a preprint in Earth System Science Data Discussions, public discussion began on Nov. 10, 2026, and the manuscript was under review.
Its preliminary central estimate for fossil CO₂ in 2026 was 38.2 billion metric tonnes of CO₂. That converts to about 42.1 billion U.S. short tons. Those are different units and should not be blended. The fossil series included an adjustment for cement carbonation.
Compared with 2025, the same central estimate was 0.4% lower. But the reported range ran from a fall of 1.5% to a rise of 0.6%. That means the direction of change was not certain from the estimate alone.
By fuel, the central comparisons with 2025 were oil down 1.9%, natural gas down 0.3% and coal up 0.6%. The project described those as estimates of CO₂ emissions by fuel, not direct measurements of the physical amount of each fuel burned.
The total anthropogenic line was separate. Including fossil emissions and changes in land use, the authors preliminarily estimated 43.3 billion metric tonnes of CO₂ in 2026. The comparable 2025 estimate was 42.8 ± 3.2 billion metric tonnes of CO₂. In the material here, the 2026 value was described as marginally above 2025, not as a statistically established rise.
The study also separated emissions from atmospheric concentration. Within its own analysis, it reported a 2025 worldwide atmospheric average of 425.6 ± 0.1 parts per million and a preliminary 2026 value of 427.7 parts per million. A possible small decline in one emissions component would not itself mean concentrations had fallen.
For a 50% likelihood of limiting warming to 1.5°C, the authors estimated a remaining budget of about 150 billion metric tonnes of CO₂ from the start of 2027. At their estimated 2026 emissions rate, that equalled less than four years of emissions. But that was an assumption-based comparison, not a predicted deadline.
The project also said the average annual growth of total anthropogenic CO₂ emissions slowed from about 1.7% in 2006–2015 to 0.3% in 2016–2025. Slower growth is not the same thing as a sustained absolute decline.
The big regional differences under the fossil CO₂ total
The global fossil CO₂ estimate also covered very different regional patterns beneath the headline number.
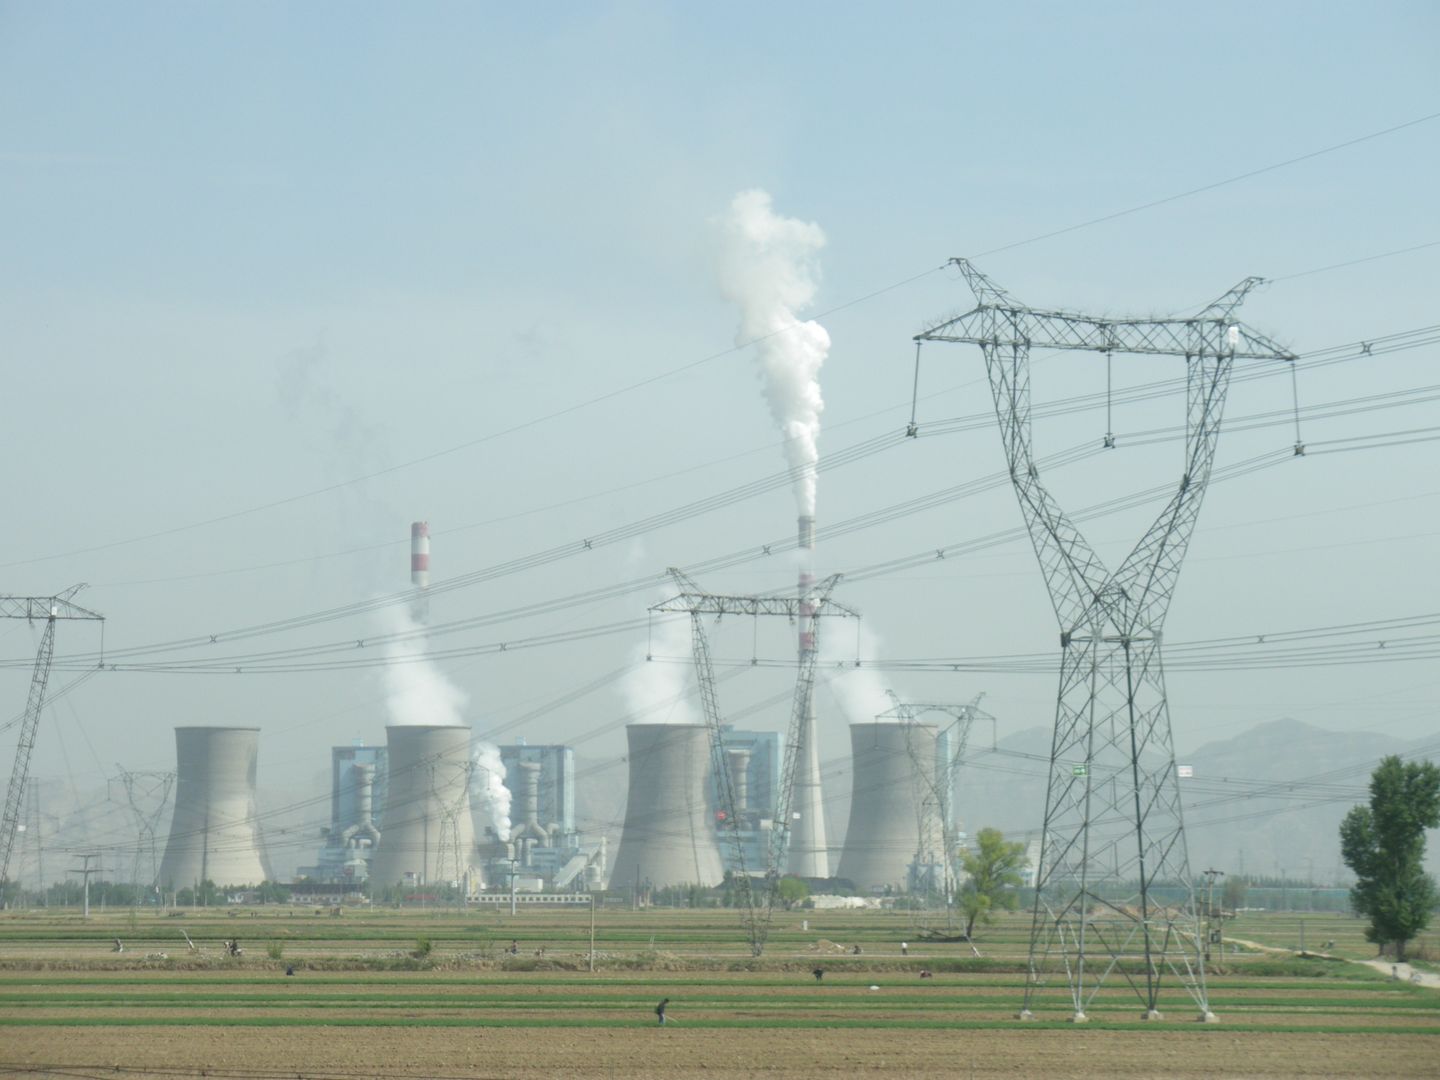
According to the Global Carbon Project’s Nov. 10 release, China accounted for 32% of global fossil CO₂. Its overall fossil CO₂ was projected to fall by 0.9% in 2026. At the same time, its coal emissions were projected to edge up by 0.3%. The same release noted a drop in Chinese oil emissions and continued growth in electricity generation from renewables. Those details matter because they show that the country-level total and the fuel-specific movements were not all pointing in the same direction.
The project also said China’s share of global emissions avoided by solar, wind and electric vehicles was about half in the authors’ estimates. That avoided-emissions finding belonged to a separate comparison with an alternative world without that generation and those vehicles. It did not mean those tonnes had been physically removed from the atmosphere, and it should not be folded into the measured fossil CO₂ total.
For the United States, the project estimated fossil CO₂ down 1.3%, mainly because coal emissions were lower. The release said that comparison followed a year when expensive natural gas and cold weather had increased coal emissions. For India, the project estimated an increase of 4.4%, above its average 3.5% annual increase over the preceding decade.
The European Union and Japan were each projected lower, by 1.5% and 1% respectively. For the rest of the world outside the separately reported countries and groups, the estimate was down 0.7%, with oil as the main component.
Each region’s percentage is calculated from its own starting level, so adding or averaging those changes would give a misleading picture. The global change is calculated from the underlying emissions totals.
The same release associated a projected 1.9% fall in world oil CO₂ with a near-term energy price and supply shock linked to the Iran conflict. It also described rising global energy demand alongside growing wind and solar capacity and use of electric vehicles. In the project’s framing, the 2026 fossil forecast showed several forces pushing annual emissions in different directions. It was not presented as proof of a durable long-run peak.
A separate accompanying Nature Climate Change paper, as described in the same release, estimated that wind and solar generation prevented 4.1 billion metric tonnes of CO₂ in 2025, with roughly 4.6 billion projected avoided in 2026. Those are counterfactual avoided emissions estimates, not measured additions to or subtractions from the annual carbon-budget total.
What Climate Action Tracker’s pathways were and were not
Climate Action Tracker’s Nov. 12 update answered yet another question. It did not measure current temperature or count current emissions. It compared conditional pathways to 2100 under different policy assumptions.
Under policies in place in 2026, Climate Action Tracker estimated about 2.7°C of global warming by 2100, compared with 2.6°C in its previous update. In the material here, that scenario was explicitly not described as one that assumed governments would roll back climate policy. It was a reading of policies judged to be in place.
If governments met their national 2030 and 2035 targets, Climate Action Tracker estimated 2.6°C by 2100. That looks numerically close to the policies-in-place figure, but it represents a different assumption set.
The group’s scenario counting current national pledges and binding longer-term targets produced 2.1°C of warming by 2100. Its most optimistic case, in which all announced targets and net-zero commitments were implemented, produced 1.9°C. Those four pathways were Climate Action Tracker scenarios and should remain attributed that way.
The tracker said actions and setbacks since its earlier assessments had broadly offset one another. It also called for faster emissions cuts to keep the scale and duration of any overshoot as small as possible. That may sound close to some of the proposals circulating in the COP31 draft, but it remained external analysis rather than negotiated COP text.
Put together, the documents around COP31 described a summit still trying to decide its language while climate agencies and researchers updated the underlying evidence. As of the presidency’s Nov. 18 work update, the key distinction held: the data sharpened the choices, but the cover decision itself was still not adopted.